
For students preparing for the biology component of the iHOSA ATC track, a frequent stumbling block is not memorizing facts, but correctly interpreting experimental data. The 2027 competition materials indicate topic compatibility between iHOSA biology content and standard international curricula—specifically, reported alignment percentages of AP 82%, IB 95%, and A-Level 83% for the biology section. This means questions often present scenarios where you must isolate the variable being tested. A core skill is separating the control result (the baseline) from the experimental effect (the change caused by the independent variable). Confusing these leads to incorrect conclusions about causality.
The Core Distinction
In any controlled experiment, the control group provides a reference point. It undergoes all procedures except the one being tested. The experimental group receives the specific treatment. The “effect” is only the difference between the two, not the absolute value of the experimental group alone. If you ignore the control, you might attribute natural variation or procedural artifacts to your treatment.
This distinction matters because iHOSA biology assessments, like other standardized science tests, frequently present data tables or graphs where the control and experimental groups are shown side by side. The skill is not merely reading the numbers, but understanding what they mean in relation to each other. Students who master this distinction perform better on data interpretation questions because they avoid the trap of treating raw experimental values as meaningful in isolation.
Teaching Illustration 1: Enzyme Activity
This is an original teaching illustration, not an official past-paper question or marking criteria.
Imagine a study testing if a new inhibitor reduces enzyme activity. You measure product formation over 10 minutes under standard temperature and pH conditions.
- Control: No inhibitor added. Product formed: 50 units.
- Experimental: Inhibitor added at 0.5 mM concentration. Product formed: 45 units.
A common mistake is seeing “45 units” and concluding the enzyme is still highly active because the number is large. However, compared to the control’s 50 units, the effect is a reduction of 5 units. The correct interpretation is that the inhibitor had a measurable, albeit small, negative effect. Without the control value of 50, the 45 is meaningless.
To calculate the effect size as a percentage: (45 − 50) / 50 × 100% = −10%. This tells us the inhibitor reduced activity by one-tenth relative to baseline. The negative sign indicates reduction. Students should practice stating both absolute differences (5 units) and relative differences (−10%) to build precision in their answers.
Teaching Illustration 2: Plant Growth Under Light
This is an original teaching illustration, not an official past-paper question or marking criteria.
Consider an experiment testing if blue light promotes stem elongation more than white light in a controlled growth chamber.
- Control (White Light): Average height increase over 14 days: 2.0 cm, standard deviation 0.15 cm.
- Experimental (Blue Light): Average height increase over 14 days: 2.1 cm, standard deviation 0.12 cm.
Here, the experimental result (2.1 cm) looks similar to the control (2.0 cm). A student might assume no effect occurred. But the 0.1 cm difference, while small, must be evaluated against the variability. With these standard deviations, a simple t-test would show whether the means are statistically distinguishable. The key takeaway is that the magnitude of the raw number (2.1) does not determine the effect; the difference relative to the control and the variability do.
Importantly, if the standard deviation were 0.5 cm instead of 0.12 cm, the same 0.1 cm difference would almost certainly be noise. This shows why control groups and measures of spread are inseparable: you need both to judge whether an experimental condition has produced a genuine change.


Diagnostic Table: Common Reasoning Errors
| Error Type | Description | Correction Strategy |
|---|---|---|
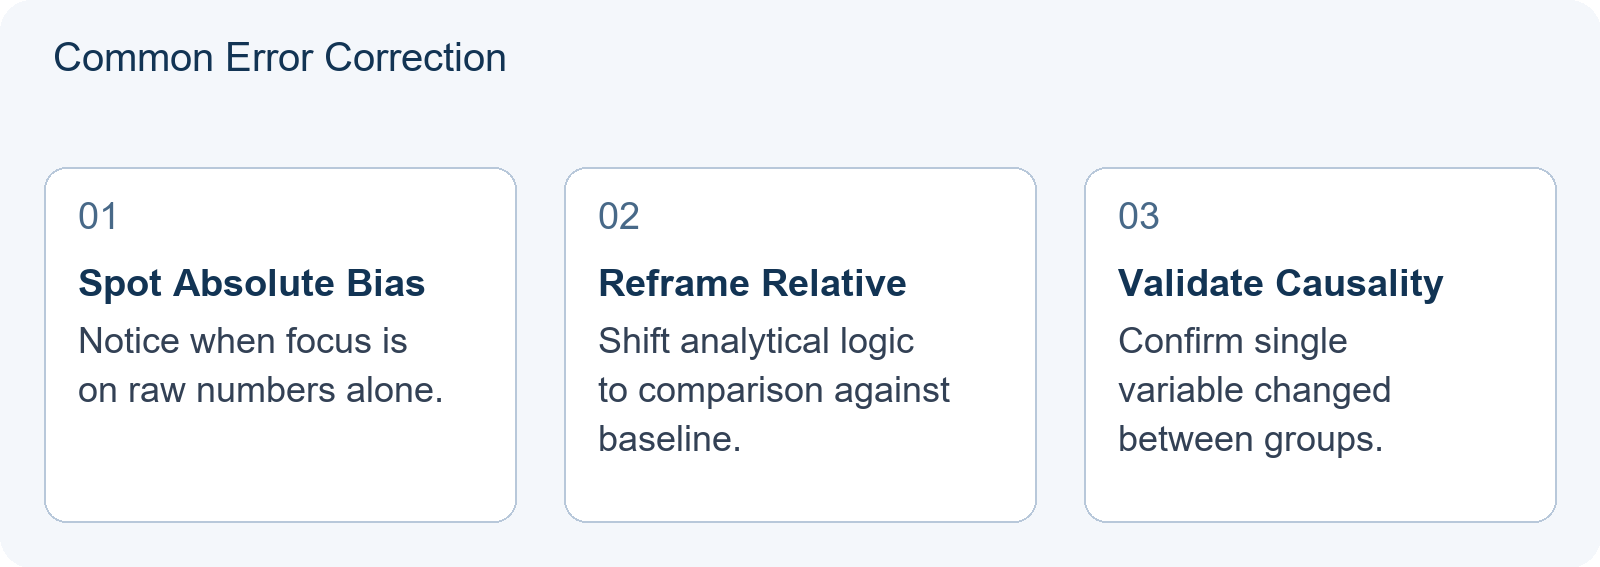
| Absolute Value Bias | Focusing on the experimental number alone (e.g., “High glucose level”) without comparing to the control baseline. | Always calculate the delta (Experimental − Control) first. |
| Ignoring Variance | Assuming a small difference means no effect, or a large difference always means significance, without checking error bars. | Check if the confidence intervals overlap. If they do, the effect may not be reliable. |
| Confounding Variables | Attributing the difference solely to the independent variable when other factors changed. | Verify that the control and experimental groups were identical in all other aspects (temperature, time, etc.). |
Practice Sequence for Preparation
To master this skill for iHOSA biology assessments, follow this sequence:
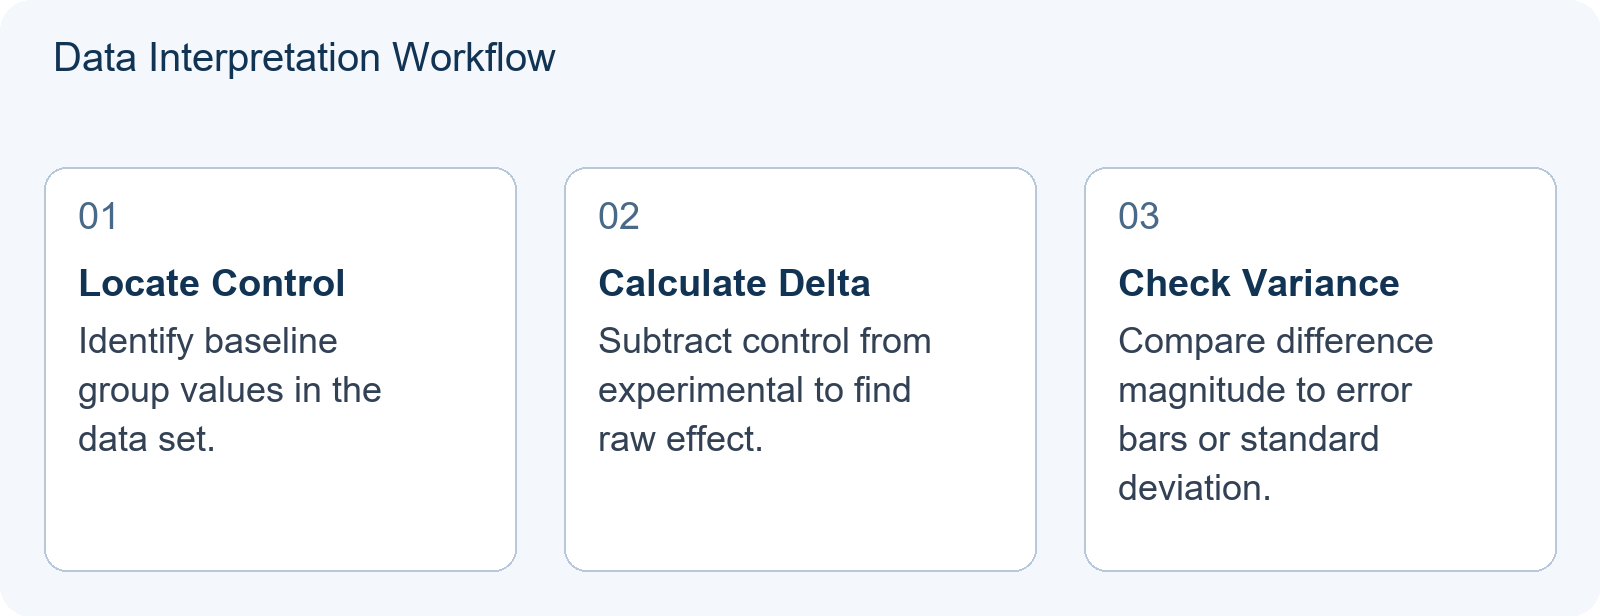
- Identify the Baseline: Locate the control group data in any practice question. Label it clearly before reading further.
- Calculate the Difference: Subtract the control mean from the experimental mean. Note the direction (increase/decrease) and record both absolute and relative values.
- Assess Significance: Look at provided error bars, standard deviations, or p-values. Is the difference larger than the expected random variation? If no variability data is given, note this limitation explicitly.
- Formulate the Conclusion: State the effect size and direction explicitly. Avoid vague terms like “it worked” or “it didn’t work.” Instead, use precise language: “The treatment increased X by Y% relative to control, which [does/does not] exceed the observed variability.”
This methodical approach ensures you answer data interpretation questions accurately. For students also considering chemistry or psychology, subject selection guidance is available. The article Biology, Chemistry or Psychology? Choosing and Preparing Your iHOSA 2027 ATC Subject by Your AP, IB or A-Level Course provides a framework for matching your current coursework to the most suitable ATC subject. Those weighing biology against nutrition specifically can consult iHOSA Biology vs Nutrition: Choosing a Preparation Focus for a Pre-Health Interest for comparative guidance. Students working on project deliverables may also find relevant preparation frameworks in iHOSA BCE Deliverable Formats: Choosing Between a PSA and a Health Education Class.
Connecting to Broader Assessment Skills
The control-experimental distinction appears across iHOSA biology topic areas. In cell biology, you might compare membrane permeability with and without a channel blocker. In genetics, you might compare mutation rates with and without a mutagen. In animal physiology, you might compare heart rate before and after a hormone administration. In each case, the same principle applies: the effect is the difference, not the raw measurement.
Students preparing for Division I (typically grades 9–10) should expect simpler data sets with clear control groups and perhaps basic averages. Division II (typically grades 11–12) may present more complex scenarios with multiple experimental conditions, time courses, or incomplete data where you must infer the control from context. The foundational skill—never treating an experimental value as self-interpreting—remains constant.
Regarding practice materials, the specific distribution policies for official past papers are not confirmed in available source documents. Students should use syllabus-aligned resources from AP, IB, or A-Level materials to practice comparable data interpretation skills, as the topic overlap figures suggest these will cover similar ground.
Frequently Asked Questions
Does iHOSA provide official past papers for this type of analysis?
The specific distribution policies for official past papers are not confirmed in available source documents. Students should use syllabus-aligned resources from AP, IB, or A-Level materials to practice comparable data interpretation skills, given the reported topic overlap percentages of AP 82%, IB 95%, and A-Level 83%.
Is statistical significance required for Division I Biology?
While formal statistics may not be heavily tested in Division I, understanding basic concepts like averages and ranges is crucial for interpreting simple experimental data sets. The core skill of comparing experimental to control values applies at both division levels.
How does this relate to the BCE project track?
In BCE projects, you must also distinguish between pre-intervention baselines and post-intervention results to demonstrate the impact of your public health initiative. The same logical framework—control versus experimental—applies whether you are analyzing test data or measuring community health outcomes.

Oct 20, 2026
iHOSA ATC Division I vs II: Allocating Study Time by Weighting Differences
Students in grades 9-10 and 11-12 face different topic weightings in the iHOSA ATC Biology and Chemistry exams. This guide breaks down…
Oct 17, 2026
iHOSA Biology Explanations: Connect a Feedback Loop to a Change in the Body
Mastering negative and positive feedback loops is essential for iHOSA Biology. Learn how to connect physiological mechanisms to observable changes with worked…
Oct 15, 2026
iHOSA Health Education: Test Whether an Audience Understood Your Message
In iHOSA Health Education, testing whether your audience understood your message is not an afterthought—it is the core deliverable. Learn how to…